Earlier this week the American Association of University Professors released its annual report on the economic status of academia. Repeating a theme from prior years, this report heavily emphasizes the position of adjunct faculty and makes a number of bold empirical claims about the alleged growth of the part time academic workforce. For example, the statement released with the report asserts:
“Faculty on part-time appointments continue to make up the largest share of the academic labor force, and the percentage of faculty jobs that are part time continued to trend higher.”
Similar claims appear throughout the full report. The AAUP uses the following figure to “prove” assertions about the current size and alleged trajectory of adjunct growth.
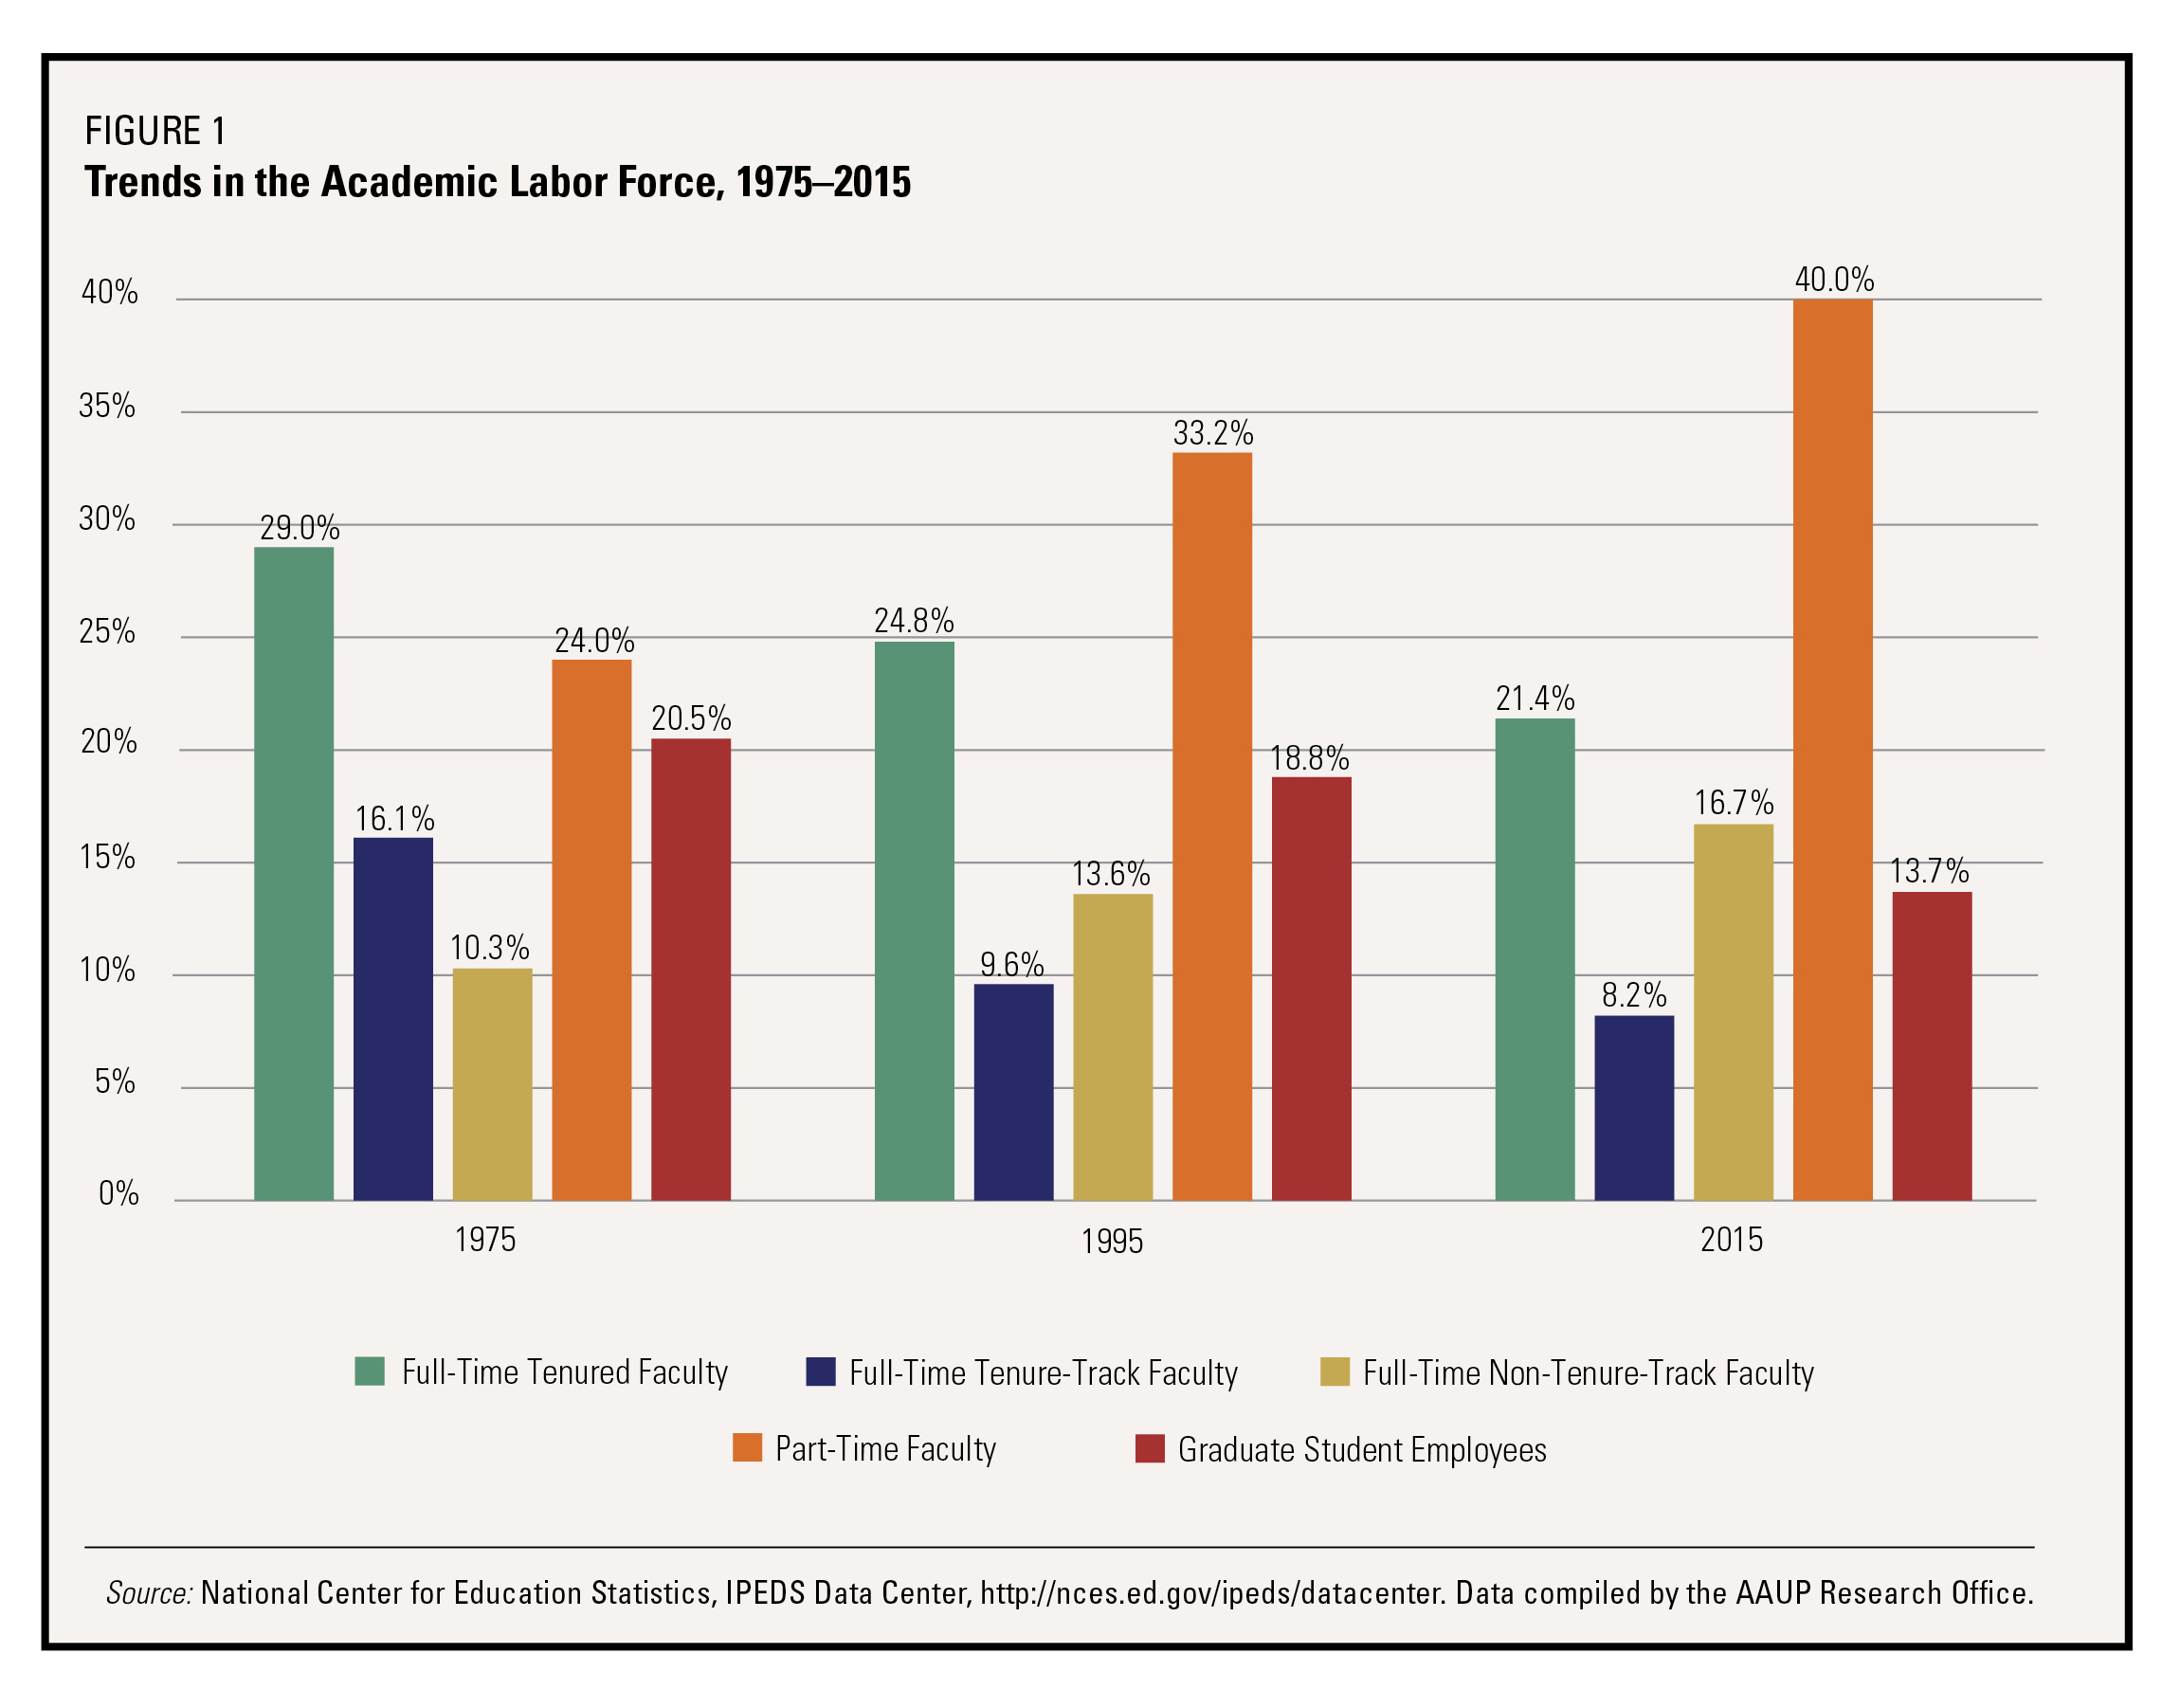
Taken at its face, the figure appears to support their contention of adjunct growth using figures from 1975, 1995, and 2015. This figure, however, is an act of empirical deception. In reality, the adjunct workforce peaked in 2011. It has been on a continuous decline ever since.
By selectively presenting only 3 actual years of data with 20-year gaps in between, the AAUP’s figure creates an illusion of dramatic and continuing growth in the higher ed adjunct workforce. They make no real effort to understand the complex causes behind these data points, and the trend they do purport to show appears to be almost willfully designed to obscure the actual drop in higher ed’s use of adjunct labor since 2011.
The actual pattern is revealed in this chart, which I compiled from the AAUP’s own previously published figures. Curiously, they abandoned the practice from previous years of including these data in their most recent report’s figures.
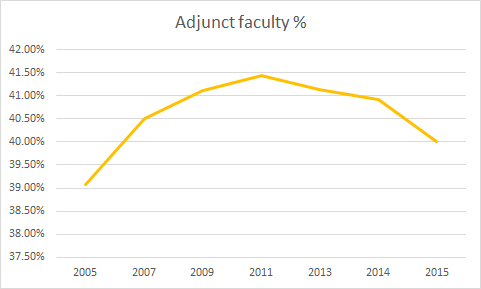
As this trend line shows, the adjunct workforce percentage peaked in 2011 and was followed by a continued decline in 2013, 2014, and 2015 (the AAUP did not release a figure for 2012). The 2015 decline was even steeper than the previous two years. As it stands right now, the total percentage of adjuncts has dropped below its published figures for 2007. One would have to go back a decade to 2005 to find a lower percentage of adjuncts.
The reasons for this decline are simple: the adjunct-heavy for-profit higher ed industry bubble collapsed around 2011, initiating a sharp overall drop in the number of adjunct faculty. As the latest stats show, this decline has continued for the past 5 years and shows no signs at the moment of letting up.
The real question though is this: why is the AAUP, in spite of evidence showing a clear and still-ongoing contraction in the adjunct workforce, asserting the opposite to be true? And why did they utilize an intentionally partial and biased statistical portrayal to obscure the fact that adjunct numbers have been shrinking for the past several years? As is often the case with the AAUP of late, political ideology appears to trump both scientific credibility and intellectual consistency.
Addendum:
The same AAUP report also obscures another trend about faculty employment. The total percentage of tenured and tenure-track faculty is actually up over the past decade, even though it is below its 1970s level. In addition to the roughly 30% of faculty who are tenured according to the AAUP figures, another 17% are employed in full time non-tenure track positions.
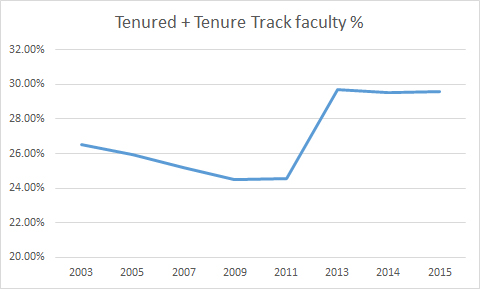
Most of this spike has also taken place after the 2007-2008 financial crisis, defying another popular but empirically unattested claim about the supposed decline of tenure.
Note that the AAUP figures also include graduate students as a “faculty” category, even though these positions are actually more akin to apprenticeships and usually come with sizable tuition credits in addition to payments. The removal of the grad student figures from their totals would have the effect of increasing the percentages of tenured and tenure-track faculty.