When Thomas Piketty’s main inequality chart for the United States came under scrutiny from myself and others over the last year, he was largely non-responsive despite his mounting of a vigorous defense of other areas of his data. (My step-by-step deconstruction of the chart may be found here for reference. Similar criticisms figured prominently in my article on Piketty’s empirics with Bob Murphy, and in Chris Giles’ critique for the Financial Times). Instead, Piketty largely deferred to a recently-released working paper by his sometimes-collaborators Emmanuel Saez and Gabriel Zucman, which purports to show soaring wealth inequality in the United States through a new estimation technique.
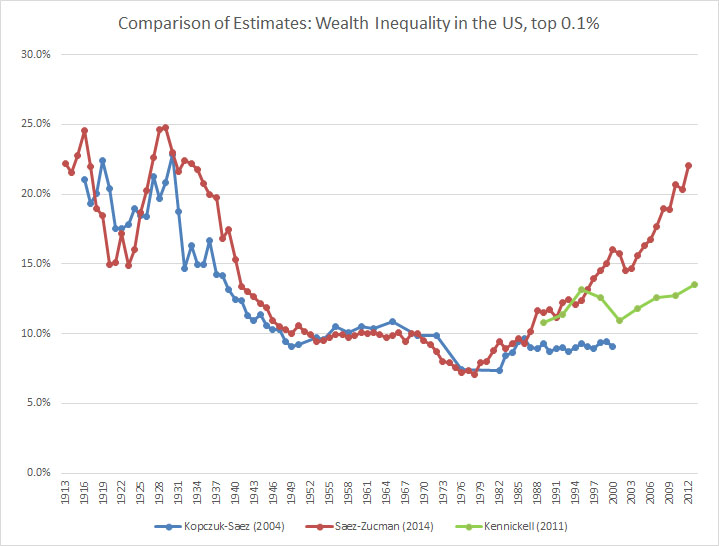
The Saez-Zucman paper first came out as a draft in the summer of 2014. Despite several early endorsements of its results before the paper was even released, Piketty among them, it has since come under greater scrutiny. Murphy and I address one of its most glaring problems at length. Specifically, the Saez-Zucman trend lines diverge sharply from two other time-tested means of estimating inequality from the mid 1980s until the present day. Those other techniques include (1) estate tax returns, most notably estimated in a 2004 article that Saez coauthored with Wojciech Kopczuk, and (2) the Federal Reserve’s Survey of Consumer Finances. As may be seen in the chart below, the new Saez-Zucman estimate (the red line) breaks away from the estate tax data (blue), which shows a flat inequality trend since the early 1980s, and the SCF (green), which shows a fluctuating and ambiguous trend but no clear rise.
Saez and Zucman argued that their new method was superior to the other two on account of claimed flaws with the estate tax and SCF methods, but the ensuing scholarly discussion has cast doubt over their explanation. Kopczuk in particular dissected it in a February 2015 article for the Tax Law Review. The entire paper is worth a read, though I’ll excerpt the relevant passage for reference:
“Saez and Zucman (2014) have their preferred explanations: they propose that SCF fails to adequately sample the rising top of the wealth distribution and suggest that the estate tax estimates err by assuming that the difference in mortality rates of the wealthy and general public stayed constant when, in fact, it may have diverged. These are plausible explanations but not without weaknesses. The SCF would have to become progressively worse over time to explain the difference in trends. Significant non-response rate in particular is certainly an issue with the SCF, but as far as we can tell they do not result in systematic bias. Saez and Zucman (2014) show that people that they classify as very wealthy (say top 1%) have significantly lower mortality rates than general public and that the differential has increased over time. However, the magnitude of this change is not sufficient for explaining the difference between estate tax estimates and capitalization estimates (see footnote 5 in Kopczuk, 2015). Furthermore, the mortality rates that underlie their evidence are much lower than those based on other sources (such as Social Security data), suggesting that deriving mortality estimates from the tax data is a perilous exercise due to the fact that not everyone files a tax return.”
The Saez-Zucman paper has since encountered rougher sailing than its initial endorsement by Piketty, as well as an acclamation by Paul Krugman when its public version existed as nothing more than a PowerPoint slide show. The 2014 working paper received a revise-and-resubmit from the Quarterly Journal of Economics, which is not uncommon for a even a high profile paper in a highly ranked journal. Its authors released a new revised version a little over a month ago, with several changes suggesting that the peer reviewers offered criticisms that were very similar to those listed in the Kopczuk article. They appear to have wanted a more robust explanation of why the Saez-Zucman inequality trend line diverged so sharply from the estate tax estimate and the SCF.
As Kopczuk anticipated, they reiterated their claim the estate tax data suffers from a mortality gradient amongst the rich and ultra-rich. I hope to address this at length in a future post as the raw numbers behind it are more ambiguous than they let on. For now I’d like to call attention to a more pressing oddity with how they reconcile the SCF. The following two charts display Saez-Zucman’s comparison of the three estimates in the 2014 and 2015 versions of the paper. Note that they update the estate tax through the present day, yielding a slightly fluctuating but still flat trend line. The biggest difference though is how they portray the SCF. While the 2014 version directly utilized the inequality estimates presented by Arthur Kennickell in a series of papers on the SCF, the 2015 version “adjusts” these estimates in a very pronounced way. The result is that Kennickell’s SCF time series, which looked almost nothing like the Saez-Zucman trend line, has now morphed to track it in a way that makes the two look very similar.
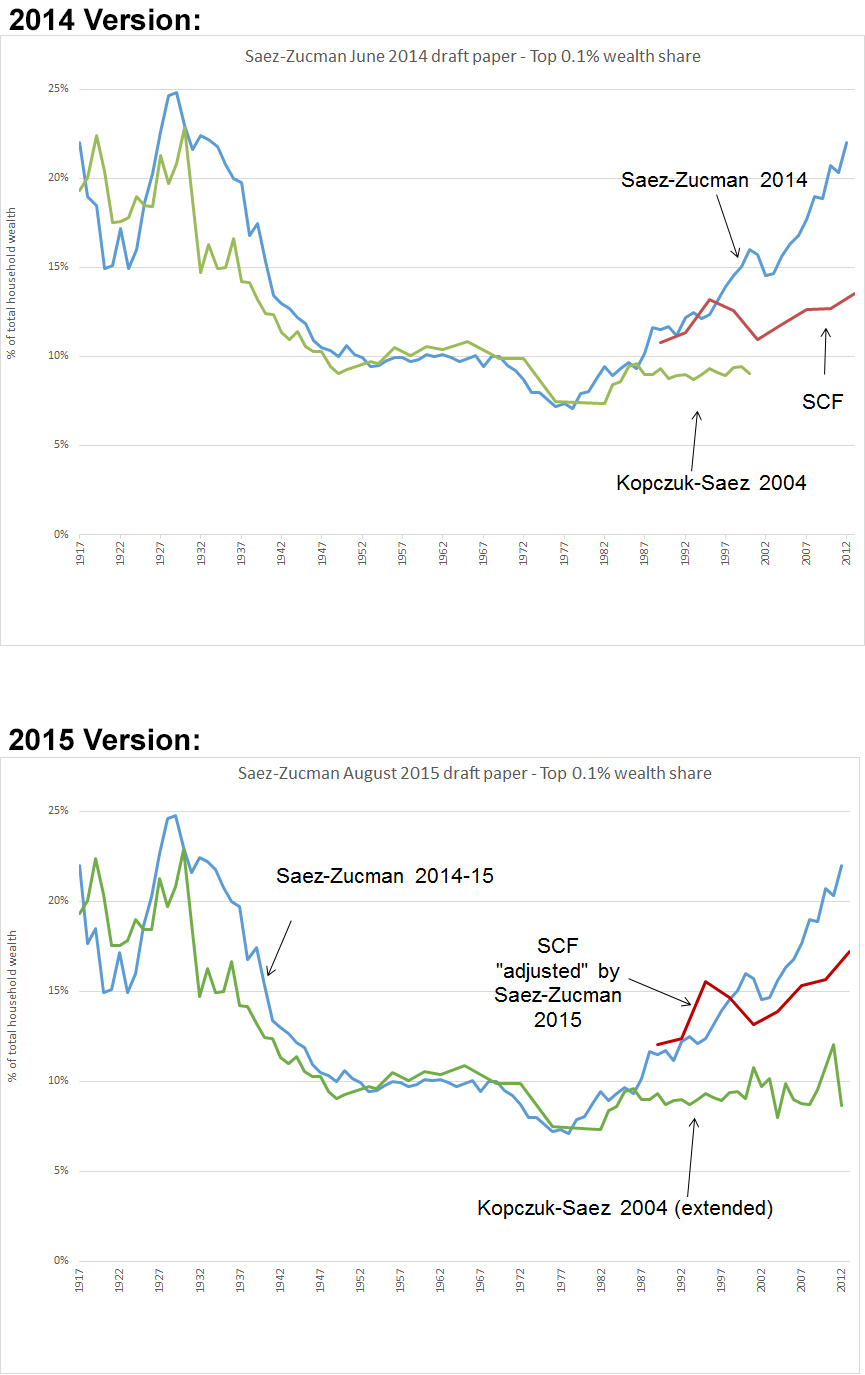
This rather curious shift is not without explanation, and in fact Saez-Zucman are perfectly open about what they are doing in this “adjustment.” Due to financial privacy issues governing their sample, the SCF survey methodology intentionally excludes members of the “Forbes 400” list of wealthiest Americans from its estimate. As Saez-Zucman note on p. 31 of their revised paper, their “adjustment” entails adding the Forbes 400 list into the SCF data (along with a couple of other lesser changes to standardize the units of comparison). They report a pronounced effect from the Forbes 400 reintegration (see footnote 54 in the paper), bringing the adjusted SCF into line with their own trend line and suggesting that it too shows skyrocketing inequality in recent years.
Saez and Zucman’s actions may seem intuitive at first glance. After all, isn’t an inequality estimate of the wealthiest Americans incomplete without the Forbes 400 list? This might indeed be the case, except for the fact that the Federal Reserve’s SCF survey methodology already corrects for the removal of the Forbes 400 list by intentionally oversampling the top tail of the wealth distribution and applying a number of internal corrections.
The SCF’s handling of the Forbes 400 list is discussed at length in the survey’s codebook and survey design literature. Since part of the SCF sample is selected using heavily regulated access to confidential IRS data, it would be theoretically possible to identify famous respondents among the ultra-wealthy, e.g. a Bill Gates or a Donald Trump, thereby violating their privacy. In order to correct for this problem, the SCF’s designers intentionally over-sample the wealthy and apply internal corrections to account for the “missing” Forbes 400 in their reported wealth distribution estimates. (In fact, due to variations in Forbes’ internal criteria for inclusion on the list, the SCF actually ends up sampling several families that fall in the Forbes 400 range without the subsequent corrections. As Kennickell noted in the SCF codebook, “In the 2010 survey, there were 10 observations that had net worth at least equal to the minimum level needed to qualify for the Forbes list”).
So how effective are the Federal Reserve’s own corrective techniques for the Forbes 400? The SCF adjustments fared comparatively well in a multi-country 2014 study by Philip Vermuelen for the European Central Bank. Vermuelen investigated the distortions that are caused by survey non-response differentials on the upper tail of the wealth distribution, which can lead to an under-sampling of the ultra-wealthy. While Vermuelen found substantial disparities between survey results and Forbes-style lists of the ultra-wealthy in the absence of oversampling and other upper tail corrections, the corrections employed by the SCF are commended in the paper as a viable technique for addressing this problem. Of course statistical corrections of this type involve a number of discretionary judgement calls, and some variation will be introduced to any estimate of the wealth distribution as a result. The SCF’s correction techniques are widely considered to be something of a gold standard for similar survey design though, raising a very real question about the need for Saez and Zucman’s additional “adjustment” to a data set that, by all appearances, has already been adjusted to account for the problem they only now purport to address.
In other words, the Saez-Zucman adjustment may not simply reintegrate the Forbes 400 list into the SCF – they may actually end up double-counting corrections that have already been made in the SCF survey design, and the predictable result is a display of skyrocketing inequality where, previously, no such trend was apparent. This finding is oddly convenient for their argument, to say the least.
Addendum (10/19/15):
Arthur Kennickell’s extended discussion of survey design of the SCF is particularly illustrative of the issues involved in the upper tail of the U.S. wealth distribution. While he does not take a direct position on augmenting the SCF results with the Forbes 400 list, the following excerpt shows that the SCF already uses multiple sampling techniques and corrections to account for this recognized discrepancy.
“The SCF employs a dual-frame sample to provide a sufficient basis for collecting data for the major purposes of the survey (see Kennickell and Woodburn [1997]). An area-probability sample (see Tourangeau et al. [1993] and O’Muircheartaugh et al. [2002]) is used to provide robust coverage of characteristics broadly distributed in the population. A list sample (see Kennickell [2007a] and references therein) is selected from statistical records derived from tax returns, using a stratification scheme to over-sample wealthy families. This over-sampling helps to address two important issues. First, because wealth is very concentrated and some items important for research and policy apply to only a relatively wealthy part of the population (e.g., tax-exempt bonds), it is necessary to take specific action in order to have a sufficient number of cases to analyze; the list sample is an efficient means (both statistically and fiscally) of addressing this problem. Second, because nonresponse in surveys often appears to be higher among wealthy families, some means of recognizing and correcting for such systematic nonresponse is needed to avoid bias in estimates that are strongly influenced by the upper tail of the distribution (such as means or concentration estimates for wealth); the stratification scheme for the list sample in the SCF provides a straightforward means of making such adjustments.”
Kennickell also warns about additional complications to the Forbes 400 list here, noting “the Forbes data may have measurement problems that complicate their use. Some of the figures they report are amounts owned by extended families or by charitable trusts controlled by (but not legally owned by) a person. SCF data suggests that they also miss some people who are as wealthy as other people included in the list.” In an older discussion of the issues involved, he notes that the Forbes 400 might nominally augment the SCF, but again identifies numerous integration issues deriving from problems with the Forbes methodology, changing membership of the Forbes 400, and the recurring tendency of the SCF to capture a handful of respondents who qualify for the Forbes 400 threshold. In any case, the issues posed by integrating the two data sources seem to be far more complex than casually supplementing the SCF with the Forbes 400 to yield a spike in inequality from an augmented and possibly double-counted upper tail.
A related issue also emerges, in that Saez-Zucman offer no explanation for why the SCF, absent their Forbes 400 adjustment, becomes increasingly separated from their own capitalization estimate of inequality as time progresses. In other words, why does the SCF track their own estimate prior to 1992, and then suddenly diverge? Surely if the SCF consistently underrepresents the upper tail of wealth due to the exclusion of the Forbes 400, this problem would consistently afflict the entire SCF trend line as opposed to only 1995-present.
In cumulative, this literature would seem to commend extreme caution in any attempt to integrate the Forbes 400 into the SCF, at the risk of accidentally inflating the responses of the upper tail to account for an issue that is both known and accounted for in the original survey design.