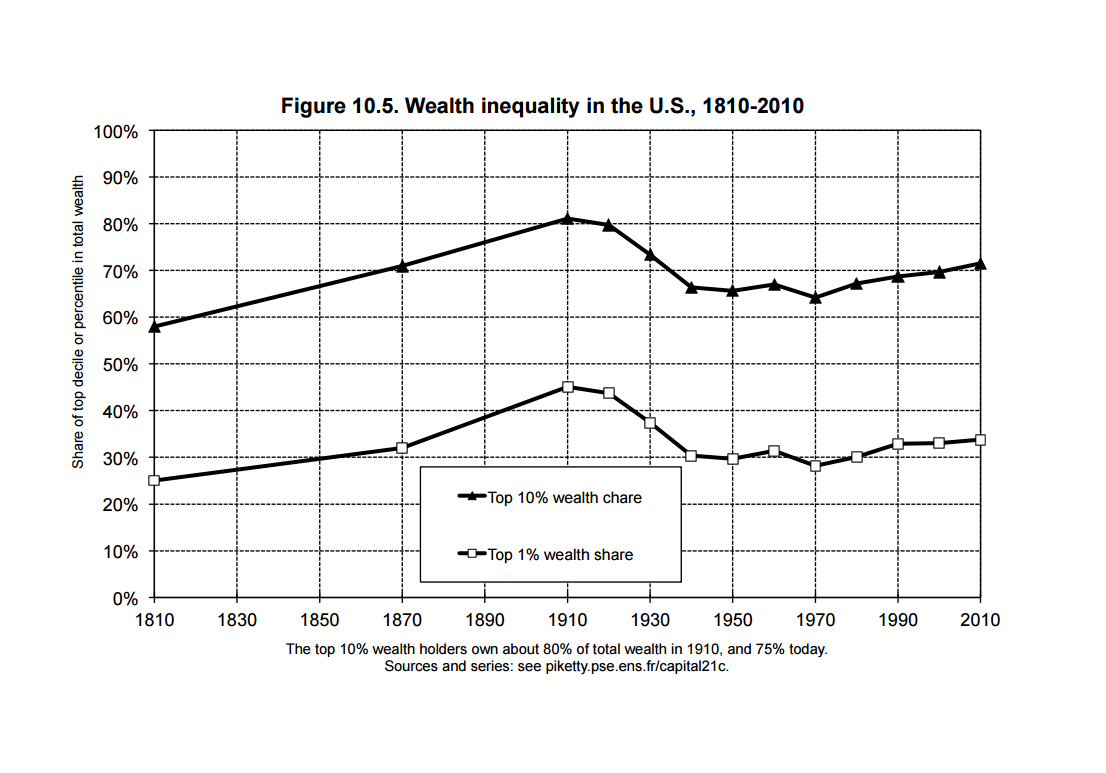
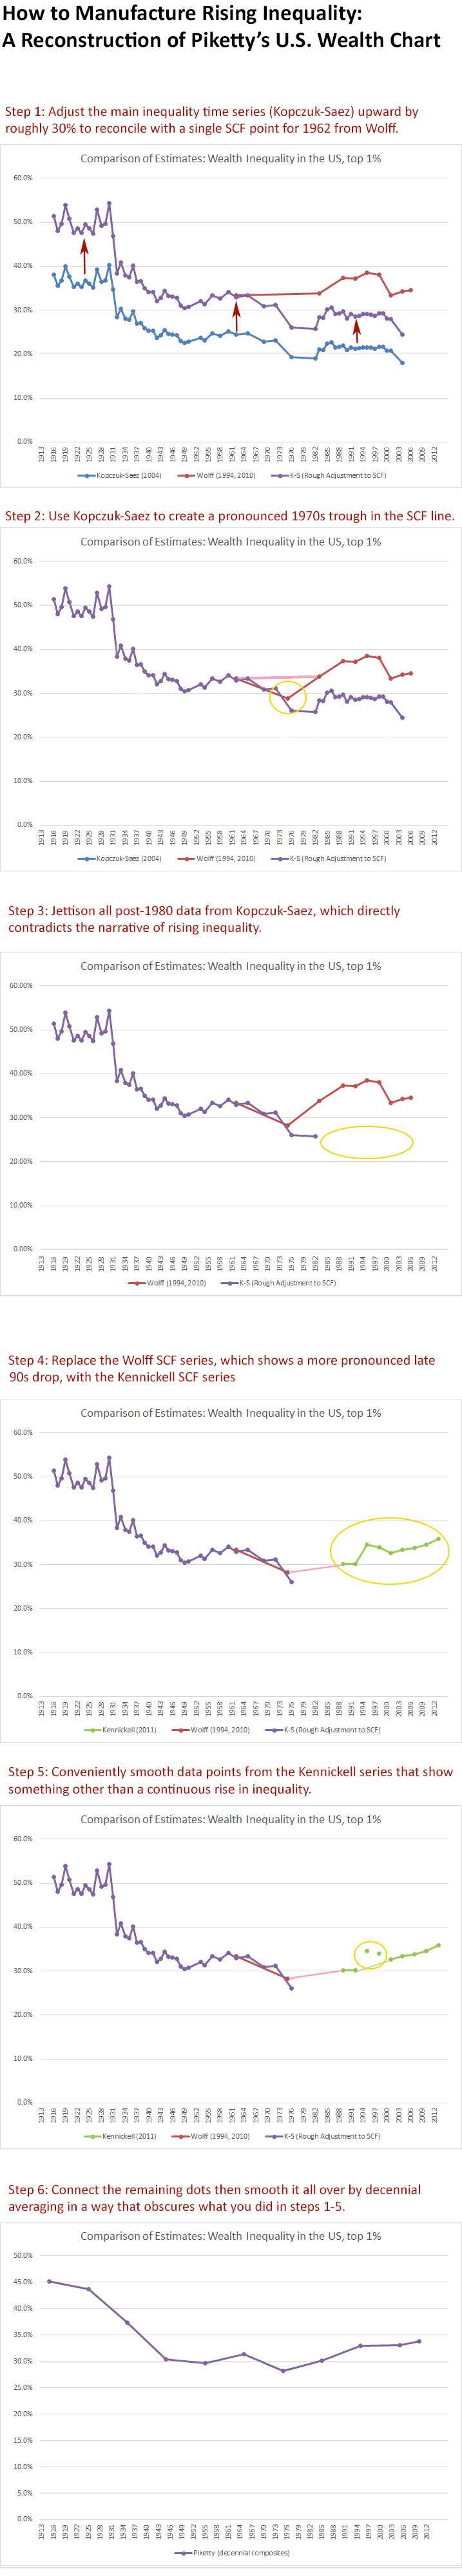
Since quite a few of Thomas Piketty’s followers are still convinced that he has empirically demonstrated a rise in wealth inequality in the past 30 years, I put together the following breakdown which illustrates how he constructed the famous “U-shape” in his Figure 10.5. As may be readily seen, neither the Kopczuk-Saez (2004) series nor of the two SCF series (Wolff & Kennickell) show a U-shape when considered independently.
Kopczuk-Saez actually shows more of an “L-shape” in which inequality precipitously declines in the Depression/WWII era then tapers off until going almost completely flat from the 1980s to the last date in the series (2004 in Saez’s last update). Wolff’s SCF estimate shows a jagged trend that modestly increases in the late 1980s, then drops to previous levels, and Kennickell shows a very modest uptick to the present day, albeit with an equally pronounced disruption around 2000 where the trend reversed. Needless to say, a stable rise in inequality from roughly 1980 to the present is not clear from any of them, and is actually contradicted by Kopczuk-Saez.
So how does one get from all that to the neat and tidy U-shape in Piketty’s chart? Certainly not by any normal “adjustment” techniques or simple “harmonization” between the series. Rather what we have is a clear case of selective cherry-picking between favorable data points, followed by the convenient omission and dropping of other points that diverge from the desired U-shape. Here’s how it is assembled, step-by-step:

These results are then reoriented to the start of each decade and appended with numbers from the 19th century (plus a massive linear interpolation across the multi-decade gaps in between), yielding the completely manufactured U-shaped result in Piketty’s Figure 10.5: