A brief note, as my last post seems to have touched a very raw nerve with one of the crankier denizens of the economics blogosphere.
I remarked very specifically at the outset of my last post that “[Daniel] Kuehn isn’t exactly the most lucid writer in the economics blogosphere, so it’s sometimes difficult to discern what he is trying to say from his writings. With that caveat in mind and making an honest effort to capture the gist of each point, I put his three purported examples to the test to see if they materially alter Piketty’s figure 10.5 in a way that works against the inequality narrative, as claimed.”
It turns out this remark was spot on, as Mr. Kuehn now appends additional specificity to the first of his three tests and proceeds to conclude that I “miscalculated” his proposed correction to Piketty on account of his newly specified terms. It now seems to be the case that when he said he took issue with Piketty’s use of “a stable multiplier of 1.25 for the 1930s through the 1950s” and suggested a preference for correcting these three points with a declining ratio, he really meant to say that he proposed a correction for all of Piketty’s adjustment ratios prior to 1960. But as I said, the guy is not a particularly lucid writer, leading to a frequent divergence between what he writes and what he apparently visualizes in his head. His various acts of thrashing and incivility aside, I’m certainly happy to entertain his newly appended suggestion on how to adjust Piketty on this point. And entertain it does!
Now Kuehn’s newly-elaborated proposal for performing this adjustment entails projecting an adjustment ratio from the SCF backwards starting at the 1960s and presumably extending across the entire Kopczuk-Saez series before that point. Indeed anything less would be an inconsistent act of selectively choosing some years and not others, so that means we should actually extend his proposition from 1960 all the way back to the start of the series in 1910. Of course there was no SCF measure of inequality in 1910. Or 1920. Or 1930, 1940 etc. So there’s really no guarantee that the adjustment ratio would have actually declined at all across this period. In fact, Kuehn hasn’t really articulated a coherent rationale as to why he thinks that adjustment ratio should decline when moving backwards from 1960. He simply assumes that it should since the smoothed over post-1960 SCF data shows a slightly growing divergence. Therefore he seems to believe that a backward projection into the decades prior to the SCF series should show a continuation of this backward-working convergence (sidenote: see Auerbach & Hassett for a discussion of how Piketty’s smoothing of the SCF series may introduce its own distortions, but I digress). But since we’re entertaining, we can see what that does to Piketty’s chart.
It’s important to note at this point that even if we assume the adjustment ratio should be projected backwards from 1960 – which, again, is a big assumption – there is no one single “correct” way of performing that projection. Kuehn suggests one possible “conservative” approach of reducing the ratio by about 0.04 per decade as we move backwards in time. He does not further elaborate on how he gets this apparent back-of-the-envelope reduction, so I’ll assume it comes from eyeballing it. But let’s take him at his word and make that the “conservative” estimate. Now a more rigorous reading of Kuehn’s prescriptive correction suggests that he sees the reduction as a sustained statistical trend. So estimating it would entail actually fitting a trend line to the SCF data for 1960-2000 and then following it backwards. If we do that, we can quickly produce a linear rate of reduction that’s chained to the existing KS/SCF adjustment ratios in each of those years. This actual trend projection is a bit steeper than simply subtracting 0.04 per decade, so let’s call that the most “liberal” estimate – i.e. assuming that the ratio continued to reduce at the same rate we seen by going backward between 2000 and 1960. The results of these two approaches, and a whole range of everything in between, may be seen here as overlaid with Piketty’s original trend line:
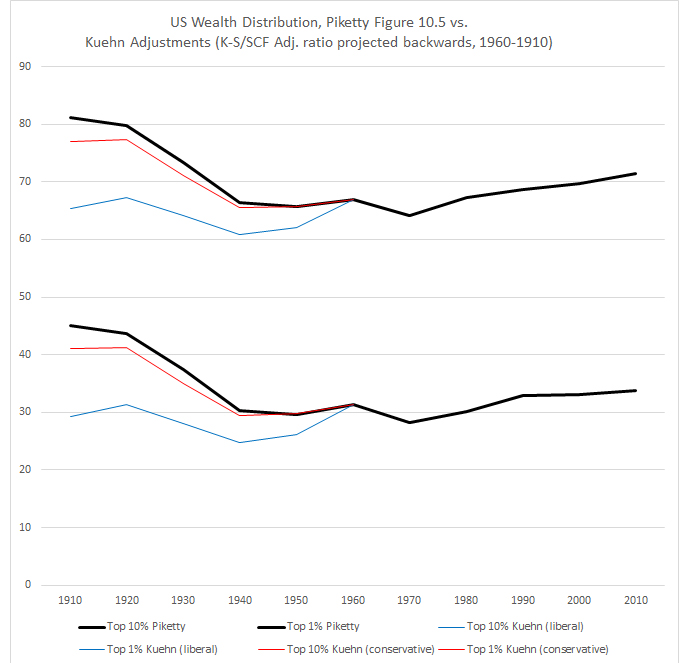
Now a few concluding observations:
First – it’s not at all evident how either of these corrections, be it the “conservative” 0.04 reduction or “liberal” linear projection of the adjustment ratio, would bolster Piketty’s inequality narrative. If anything, the exact opposite is true – Kuehn’s proposed change to the model would make it less consistent on the whole with Piketty’s narrative. The only noteworthy effect of either adjustment (or really any projected ratio decline in between these two extremes) is to reduce Piketty’s estimate for wealth inequality on the whole for the first half of the 20th century. Doing so would, of course, work directly against Piketty’s narrative, because it would mean that (1) the outset of the 20th century wasn’t as unequal as Piketty claims and (2) the century-long U-shape that Piketty projects isn’t nearly as pronounced. Note that I am not endorsing either proposition but simply pointing out that they are the implications for Piketty’s narrative that Mr. Kuehn’s proposed adjustment entails, and that neither helps his argument.
Second – a hearty congratulation for Daniel Kuehn is in order. Although I won’t venture a further comment on its merits, he’s just postulated a scenario where wealth inequality in the United States is significantly flatter than Piketty claims across the entire 20th century!