I mentioned in my previous post that Thomas Piketty really likes building decennial averages out of annual time series data. As part of the ongoing examination of his historical stats, let’s take a closer look at another one of his graphs, Figure 11.12 covering wealth transfers by inheritance as a percentage of national income across three European countries. Note that this graph is part of his larger historical argument about changes in wealth distribution from the early to mid 20th century from something of a turn-of-the-century peak in wealth inequality.
The associated excel file gives us a closer peek into his averaging technique. His source data for the UK in Figure 11.12 is a 2012 paper by A.B. Atkinson, which provides a relatively complete estimate of annual inheritance flows between 1896 and 2008, except for a few gaps around the two world wars. For most of the 20th century Piketty’s averaging technique uses full decades of Atkinson’s data. So his formula for the 1960s, for example, consists of adding up percentages derived from Atkinson’s annual numbers (and widely available national income data) for 1960-69 and dividing the total by 10. But Piketty also does something odd at the outset of his averaging process. Take a closer look at his formula for the first decade of the 1900s:
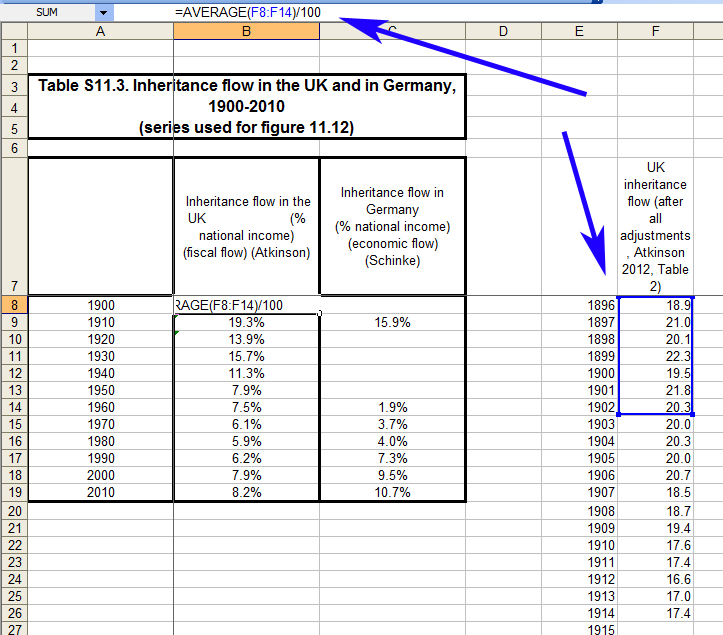
As you can see from the cells in the blue box, his average for the 1900s is actually an average of the data from 1896 to 1902. Look at the 1910s next and you will find that his average here is actually for the years 1903-1910:
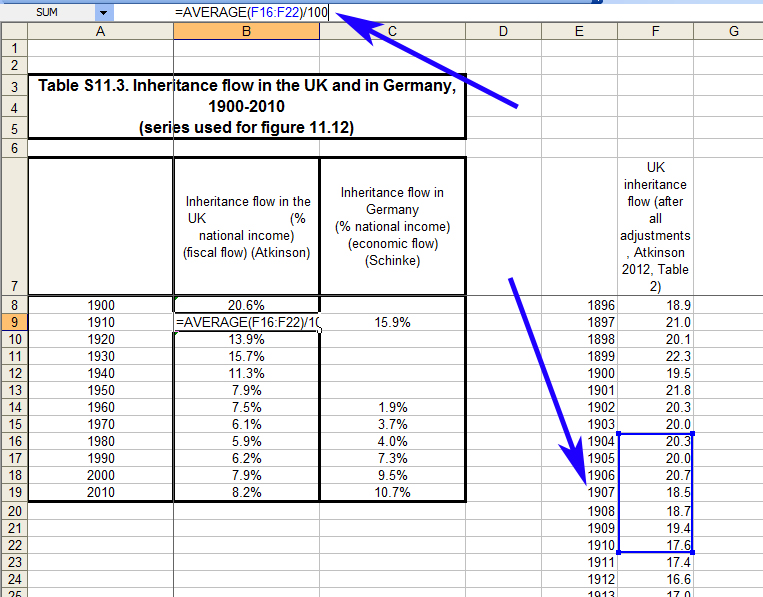
The Atkinson data set includes figures for 1911-1914, followed by a 6 year gap during World War I. Piketty omits these however, and opts to take his 1910s average from a set of data points that are actually in the decade prior. Now jump to 1920:

Here we’re back on track with his normal formula, covering the years 1920-29. This pattern holds for the remainder of the averages that comprise his graph.
In summary, the number Piketty represented as the 1900s decennial average was actually situated (mostly) in the 1890s, and his 1910s average was actually situated in the 1900s.
What exactly is going on here? My initial thought was that this might be his attempt to account for the WWI data gap of 1915-19…except that he neglects to make a similar adjustment for the WWII data gap of 1942-45, using his “normal” averaging formula for the decade instead. This would suggest something else is at play.
So let’s take a closer look at the annual data that Piketty uses before it is converted into decennial averages. Here is what Piketty begins with from Atkinson, covering 1900-1914.
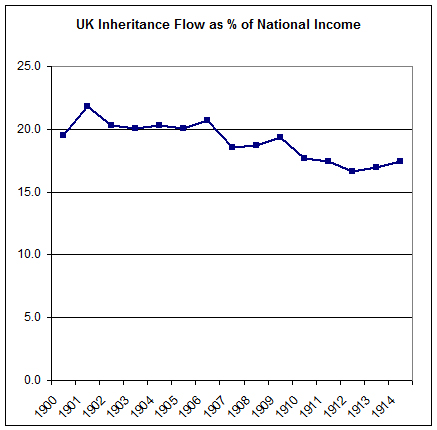
Notice that the Atkinson data suggest a modest downward trend in the UK inheritance flow ratios from the turn of the century until the eve of WWI. Specifically, we see a high of 21.8% in 1901 followed by a relatively steady decline to 17.4% in 1914. Compare that to the change in Piketty’s decennial averages from 20.6% for 1900 to 19.3% for 1910, and it’s immediately evident that something is being lost in the averaging process.
Given the abundance of stray data points, unexplained weighting, and other data oddities we’ve seen with Piketty’s work so far, it’s entirely possible that this is simply more evidence of carelessness, error, or stray whims of data tweaking for no apparent reason. It could also be noted though that Piketty’s decennial averages – which are, again, backdated to prior decades for 1900 and 1910 – suggest a substantially flatter and indeed almost non-existent drop over these years (1.3 percentage points in Piketty’s decennial average versus the actual 4.4 percentage points using annual data).
Though perhaps not by conscious design, it might also be noted that Piketty’s flatter line – attained by his odd and backdated averaging technique – comes with the convenience of consistency with his broader narrative that events set into motion in the destructiveness of World War I more or less triggered a pattern of declining wealth inequality that continued through the mid 20th century. Alternatively, a modest but already-declining pattern of UK inheritance flows in the decade and a half before the war might create a wrinkle in that narrative that is at least worthy of a closer investigation.