My previous posts on the data problems in Piketty’s Capital in the Twenty First Century have focused almost entirely on errors contained within his data charts and files. But what happens when one tries to reconstruct those files?
To find out, I conducted a simple experiment using Piketty’s Figure 10.5 – the widely cited depiction of wealth inequality in the United States over the past century. I previously deconstructed and critiqued this chart at length, concluding that it is essentially a Frankenstein graph – a clunky assemblage of cherry-picked data points from multiple divergent sources and arranged in an order that seems to confirm Piketty’s historical narrative about a dramatic upturn in inequality since the early 1980s. The purpose was to reconstruct Piketty’s chart using his own source data and techniques, only I would cherry-pick different “representative” numbers than Piketty did from within those sources as needed.
The rules:
1. I had to use the same data sources that Piketty used in constructing the original. These consist of the estate tax study by Kopczuk & Saez (2004) and SCF studies by Wolff (1994, 2010) and Kennickell (2009, 2011).
2. My time series would be constructed the same way that Piketty constructed his: decennial averages of the century long trend, using data points from the aforementioned studies to obtain a “representative” estimate for each decade.
3. I could only use adjustment techniques that Piketty also used in reconciling differences within the sources. This included applying an adjustment ratio to bring Kopczuk-Saez in line with the SCF studies, light averaging to fill in gap years if needed, and a rough estimation of the top 10% from top 1% numbers where such numbers were not available (i.e. copying Piketty’s technique of adding 36 percentage points to the lower trend line).
4. Where source data conflicted I was free to select between preferred data points to form the representative estimate for each decade, in keeping with Piketty who did the same.
The results of the experiment are as follows:
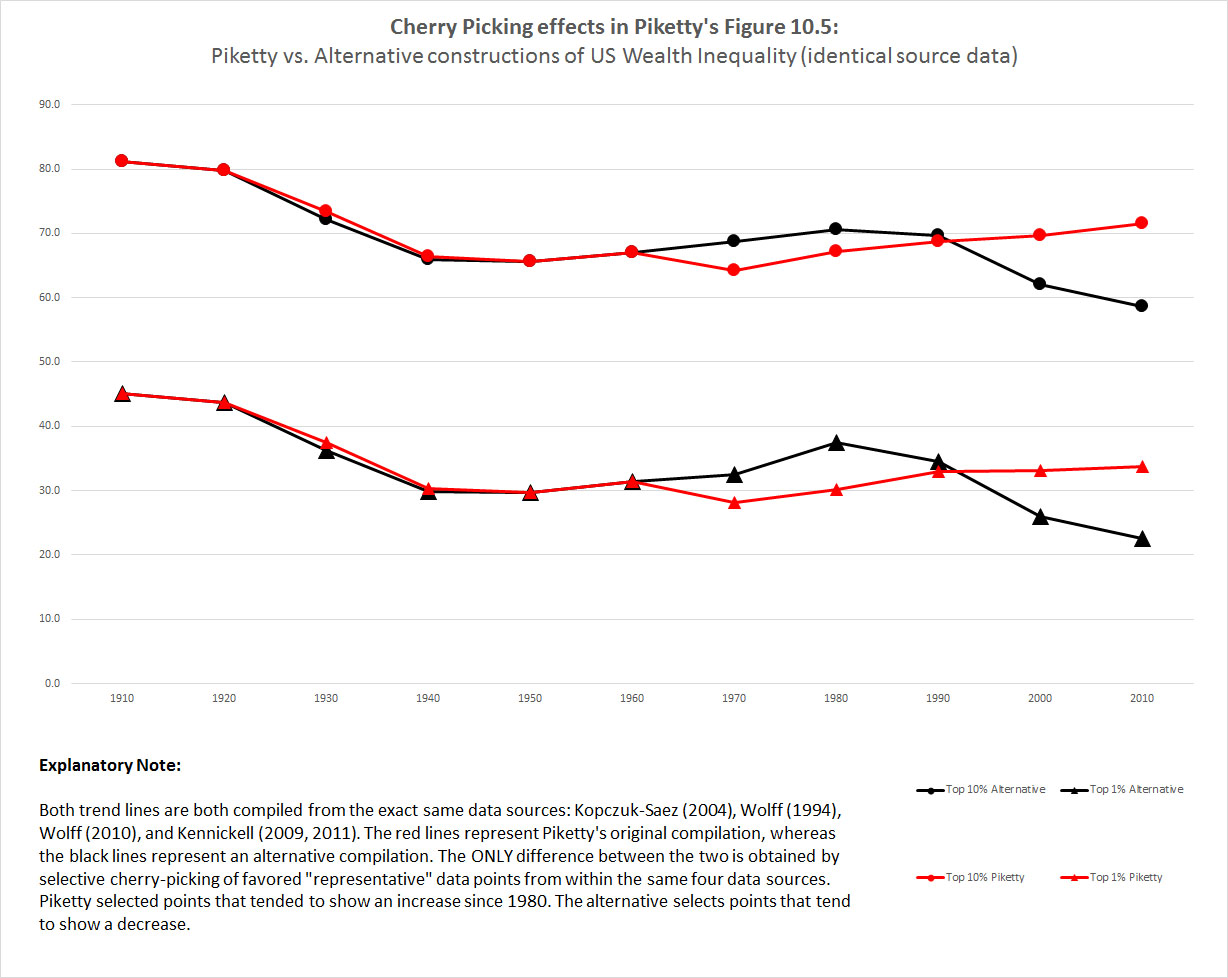
The two red lines represent Piketty’s original depiction of U.S. wealth inequality. The two black lines represent my “alternative” depiction, as derived from the exact same data sources. The differences are most evident second half of the chart. Specifically: Piketty tended to cherry-pick data points that suggested increasing inequality after 1980. My alternative does the opposite, cherry-picking data points that suggested flat or decreasing inequality. Please note that I make absolutely no pretenses that my method is more accurate. It simply exists to illustrate that one may obtain dramatically different results by preferentially selecting certain specific data points over others while still retaining Piketty’s own data sources and blending methods.
The effect is readily apparent. By cherry-picking data points that were favorable to his narrative, Piketty was able to “show” an increase in inequality over the last three decades. By cherry-picking data points that ran against his narrative even though they came from the exact same source series, I was able to “show” that inequality is actually decreasing in the same period.
In short, Piketty’s assembly of Figure 10.5 demonstrates nothing more than the ability to get its source data to say whatever one desires with enough discretionary manipulation. The product lacks any scientific rigor or interpretive value, except to illustrate the perils of a data assembly process that succumbs entirely to selection biases.